Feature progress rollup sample report
Azure DevOps Services | Azure DevOps Server 2022 - Azure DevOps Server 2019
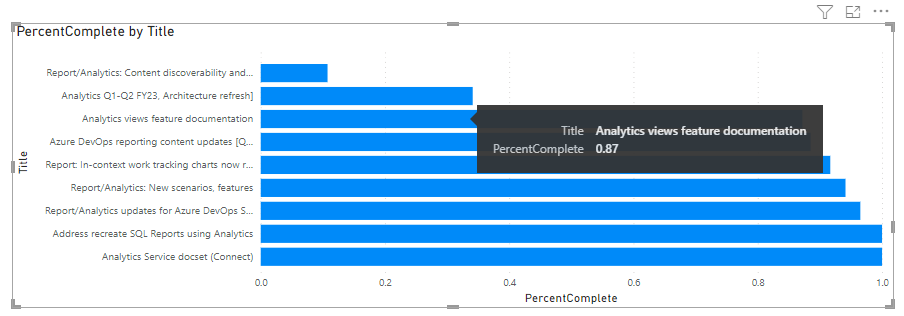
This article shows you how to create a stacked bar report to display progress of Features based on completed child User Stories. The report displays the percentage complete by rollup of Story Points for a given set of active Features. An example is shown in the following image.
You can view similar progress bar charts from your backlog by adding a rollup column. To learn how, see Display rollup progress or totals.
Note
This article assumes you've read Overview of Sample Reports using OData Queries and have a basic understanding of Power BI.
Prerequisites
- To view Analytics data and query the service, you need to be a member of a project with Basic access or greater. By default, all project members are granted permissions to query Analytics and define Analytics views.
- To learn about other prerequisites regarding service and feature enablement and general data tracking activities, see Permissions and prerequisites to access Analytics.
Sample queries
Feature progress queries the WorkItems entity to get the current state of progress.
Note
To determine available properties for filter or report purposes, see Metadata reference for Azure Boards. You can filter your queries or return properties using any of the Property values under an EntityType or NavigationPropertyBinding Path values available with an EntitySet. Each EntitySet corresponds to an EntityType. To learn more about the data type of each value, review the metadata provided for the corresponding EntityType.
Review feature progress based on an area path
You can paste the Power BI query listed below directly into the Get Data->Blank Query window. For more information, review Overview of sample reports using OData queries.
let
   Source = OData.Feed ("https://analytics.dev.azure.com/{organization}/{project}/_odata/v3.0-preview/WorkItems?"
        &"$filter=WorkItemType eq 'Feature' "
            &"and State ne 'Removed' "
            &"and startswith(Area/AreaPath,'{areapath}') "
            &"and Descendants/any()"
            &"&$select=WorkItemId,Title,Area,Iteration,AssignedTo,WorkItemType,State,AreaSK"
            &"&$expand=Descendants( "
            &"$apply=filter(WorkItemType eq 'User Story') "
                &"/groupby((StateCategory), "
                &"aggregate(StoryPoints with sum as TotalStoryPoints)) "
            &")  "
    ,null, [Implementation="2.0",OmitValues = ODataOmitValues.Nulls,ODataVersion = 4])
in
    Source
Substitution strings and query breakdown
Substitute the following strings with your values. Don't include brackets {} with your substitution. For example if your organization name is "Fabrikam", replace {organization} with Fabrikam, not {Fabrikam}.
{organization}- Your organization name{project}- Your team project name, or omit/{project}entirely, for a cross-project query{areapath}- Your Area Path. Example format:Project/Level1/Level2.
Query breakdown
The following table describes each part of the query.
Query part
Description
$filter=WorkItemType eq 'Feature'
Return Features.
and State ne 'Cut'
Omit Features marked as Cut.
and startswith(Area/AreaPath,'{areapath}')
Return work items under a specific Area Path. Replacing with Area/AreaPath eq '{areapath}' returns items at a specific Area Path.
To filter by Team Name, use the filter statement Teams/any(x:x/TeamName eq '{teamname})'.
and Descendants/any()
Filter out any work items that have at least one or "any" descendant. Includes all Features with at least one Child work item. To get all work items with their descendants, even if they don't have any, run a query without the Descendants/any() filter. To omit Features that don't have child User Stories, replace with any(d:d/WorkItemType eq 'User Story').
For all work items with and without descendants:
$filter=endswith(Area/AreaPath,'suffix')
&$select=WorkItemId,Title,WorkItemType,State,Area, Descendants
&$expand=Descendants($select=WorkItemId)
For all work items with at least one descendant:
$filter=endswith(Area/AreaPath, 'suffix')and Descendants/any()
&$select=WorkItemId,Title,WorkItemType,State,Area, Descendants
&$expand=Descendants($select=WorkItemId)
&$select=WorkItemId, Title, WorkItemType, State
Select properties to return.
&$expand=Descendants(
Start of expand Descendants clause
$apply=filter(WorkItemType eq 'User Story')
Filter the descendants. Only include User Stories (omit Tasks and Bugs).
/groupby((StateCategory),
Group the rollup by StateCategory. For more information on State Categories, see How workflow states and state categories are used in Backlogs and Boards.
aggregate(StoryPoints with sum as TotalStoryPoints))
Aggregate sum of Story Points.
)
Close Descendants() clause.
Review feature progress for a team
The following query is the same as the one used above, except it filters by Team Name rather than Area Path.
You can paste the Power BI query listed below directly into the Get Data->Blank Query window. For more information, review Overview of sample reports using OData queries.
let
   Source = OData.Feed ("https://analytics.dev.azure.com/{organization}/{project}/_odata/v3.0-preview/WorkItems?"
        &"$filter=WorkItemType eq 'Feature' "
            &"and State ne 'Cut' "
            &"and (Teams/any(x:x/TeamName eq '{teamname}) or Teams/any(x:x/TeamName eq '{teamname}) or Teams/any(x:x/TeamName eq '{teamname}) "
            &"and Descendants/any() "
        &"&$select=WorkItemId,Title,WorkItemType,State,AreaSK "
        &"&$expand=Descendants( "
            &"$apply=filter(WorkItemType eq 'User Story') "
                &"/groupby((StateCategory), "
                &"aggregate(StoryPoints with sum as TotalStoryPoints)) "
            &")  "
    ,null, [Implementation="2.0",OmitValues = ODataOmitValues.Nulls,ODataVersion = 4])
in
    Source
Transform the data in Power Query Editor
The query returns several columns that you need to expand before you can use them to create a report. Any entity pulled in using an OData $expand statement returns a record with potentially several fields. Expand the record to flatten the entity into its fields.
For the Feature Progress report, you'll need to carry out the following transforms:
- Expand the
Descendantscolumn into two columns:Descendants.StateCategoryandDescendants.TotalStoryPoints - Apply Pivot Column transform on
Descendants.StateCategorycolumn to separate out individual State categories - Replace null values in all pivoted columns.
- Add a custom column to represent percentage complete. The custom column will display errors if there are any null columns in the pivoted State columns.
To learn how, see the following sections in Transform Analytics data to generate Power BI reports:
- Expand Descendants column.
- Pivot Descendants.StateCategory column.
- Replace null values.
- Create a percentage complete computed column
Note
In this example, the State values for User Story include Proposed, In Progress, and Completed.
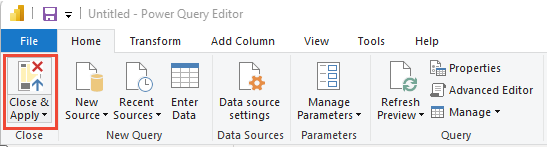
Close the query and apply your changes
Once you've completed all your data transformations, choose Close & Apply from the Home menu to save the query and return to the Report tab in Power BI.
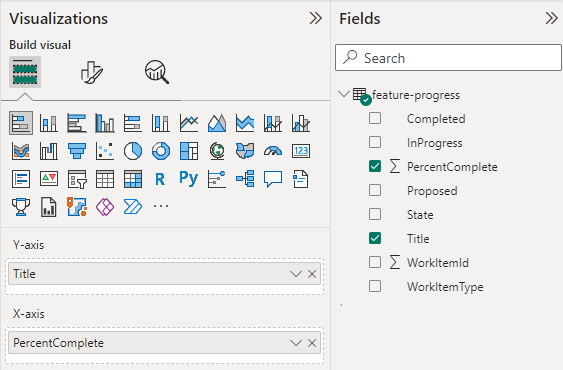
Create the stacked bar chart report
In Power BI, choose Stacked bar chart report under Visualizations.
Add
Titleto Y-Axis.Add
PercentCompleteto X-Axis, right-click and select Sum.
The example report displays.
Related articles
Feedback
Coming soon: Throughout 2024 we will be phasing out GitHub Issues as the feedback mechanism for content and replacing it with a new feedback system. For more information see: https://aka.ms/ContentUserFeedback.
Submit and view feedback for