Pass rate trend of a test sample report
Azure DevOps Services | Azure DevOps Server 2022 | Azure DevOps Server 2020
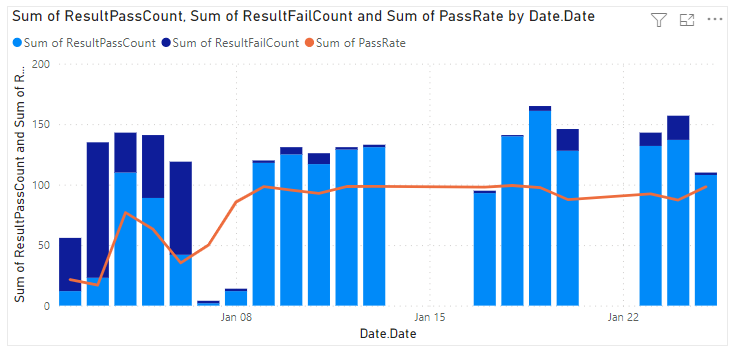
Pass rate trend reports provide insight into average time it takes for a particular test to execute during a pipeline run.
An example is shown in the following image.
Important
Power BI integration and access to the OData feed of the Analytics Service are generally available for Azure DevOps Services and Azure DevOps Server 2020 and later versions. The sample queries provided in this article are valid only against Azure DevOps Server 2020 and later versions, and depend on v3.0-preview or later version. We encourage you to use these queries and provide us feedback.
Prerequisites
- To view Analytics data and query the service, you need to be a member of a project with Basic access or greater. By default, all project members are granted permissions to query Analytics and define Analytics views.
- To learn about other prerequisites regarding service and feature enablement and general data tracking activities, see Permissions and prerequisites to access Analytics.
Note
This article assumes you've read Overview of Sample Reports using OData Queries and have a basic understanding of Power BI.
Sample queries
Note
This article assumes you've read Overview of Sample Reports using OData Queries and have a basic understanding of Power BI.
You can paste the Power BI query listed below directly into the Get Data->Blank Query window. For more information, review Overview of sample reports using OData queries.
let
   Source = OData.Feed ("https://analytics.dev.azure.com/{organization}/{project}/_odata/v4.0-preview/TestResultsDaily?
$apply=filter("
                &"Pipeline/PipelineName eq '{pipelineName}' "
                &"And Date/Date ge {startdate} "
        &"And Test/TestName eq '{testName}' "
        &"And Workflow eq 'Build') "
            &"/groupby((Date/Date), "
                &"aggregate( "
                &"ResultCount with sum as TotalCount, "
            &"ResultPassCount with sum as ResultPassCount, "
                &"ResultFailCount with sum as ResultFailCount, "
            &"ResultAbortedCount with sum as ResultAbortedCount, "
        &"ResultErrorCount with sum as ResultErrorCount, "
    &"ResultInconclusiveCount with sum as ResultInconclusiveCount, "
    &"ResultNotExecutedCount with sum as ResultNotExecutedCount, "
    &"ResultNotImpactedCount with sum as ResultNotImpactedCount)) "
    &"/filter(ResultFailCount gt 0) "
    &"/compute( "
    &"iif(TotalCount gt ResultNotExecutedCount, ((ResultPassCount add ResultNotImpactedCount) div cast(TotalCount sub ResultNotExecutedCount, Edm.Decimal)) mul 100, 0) as PassRate) "
    ,null, [Implementation="2.0",OmitValues = ODataOmitValues.Nulls,ODataVersion = 4])
in
    Source
Substitution strings and query breakdown
Substitute the following strings with your values. Don't include brackets {} with your substitution. For example if your organization name is "Fabrikam", replace {organization} with Fabrikam, not {Fabrikam}.
{organization}- Your organization name{project}- Your team project name{pipelinename}- Your pipeline name. Example:Fabrikam hourly build pipeline{testName}- Your test name{startdate}- The date to start your report. Format: YYYY-MM-DDZ. Example:2021-09-01Zrepresents September 1, 2021. Don't enclose in quotes or brackets and use two digits for both, month and date.
Query breakdown
The following table describes each part of the query.
Query part
Description
$apply=filter(
Start filter() clause.
Pipeline/PipelineName eq '{pipelineName}'
Return test runs for the specified pipeline
And Date/Date ge {startdate}
Return test runs on or after the specified date.
And Test/TestName eq '{testName}'
Return test runs only for the specified test name.
and Workflow eq 'Build'
Return test runs for Build workflow.
)
Close filter() clause.
/groupby(
Start groupby() clause.
(Date/Date),
Group by the completion date of test run.
aggregate(
Start aggregate clause to sum different test run outcomes matching the filter criteria.
ResultCount with sum as TotalCount,
Count the total number of test runs as TotalCount.
ResultPassCount with sum as ResultPassCount,
Count the total number of passed test runs as ResultPassCount.
ResultFailCount with sum as ResultFailCount,
Count the total number of failed test runs as ResultFailCount.
ResultAbortedCount with sum as ResultAbortedCount,
Count the total number of aborted test runs as ResultAbortedCount.
ResultErrorCount with sum as ResultErrorCount,
Count the total number of test runs marked as having an error as ResultErrorCount.
ResultNotExecutedCount with sum as ResultNotExecutedCount,
Count the total number of not executed test runs as ResultNotExecutedCount.
ResultNotImpactedCount with sum as ResultNotImpactedCount
Count the total number of not affected test runs as ResultNotImpactedCount.
))
Close aggregate() and groupby() clauses.
/compute(
Start compute() clause.
iif(TotalCount gt ResultNotExecutedCount, ((ResultPassCount add ResultNotImpactedCount) div cast(TotalCount sub ResultNotExecutedCount, Edm.Decimal)) mul 100, 0) as PassRate)
For all the days, calculate the PassRate .
)
Close compute() clause.
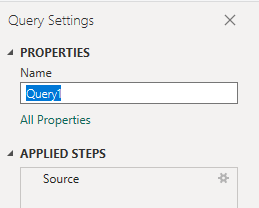
(Optional) Rename query
You can rename the default query label, Query1, to something more meaningful. Simply enter a new name from the Query Settings pane.
Expand the Date column in Power BI
Expand the Date column to show the expanded entity CompletedOn.Date. Expanding a column flattens the record into specific fields. To learn how, see Transform Analytics data to generate Power BI reports, Expand columns.
Change column data type
From the Power Query Editor, select the
TotalCountcolumn; select Data Type from the Transform menu; and then choose Whole Number.Select the
PassRatecolumn; select Data Type from the Transform menu; and then choose Decimal Number.
To learn more about changing the data type, see Transform Analytics data to generate Power BI reports, Transform a column data type.
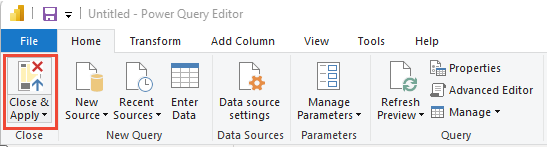
Close the query and apply your changes
Once you've completed all your data transformations, choose Close & Apply from the Home menu to save the query and return to the Report tab in Power BI.
Create the line and stack column chart report
In Power BI, under Visualizations, choose the Line and stack column chart and drag and drop the fields onto the chart areas.
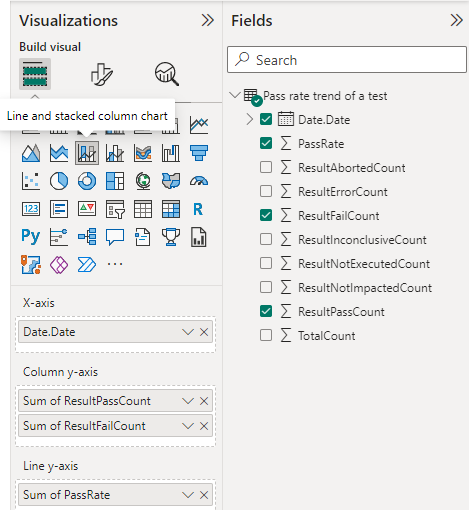
Add
Date.Dateto the X-axis, right-click the field and select Date.Date rather than Date Hierarchy.Add
ResultPassCountandResultFailCountto the Column y-axis.Add
PassRateto the Line y-axis.
Your report should look similar to the following image.
Test task resources
- Run tests in parallel using the Visual Studio Test task
- Run tests in parallel for any test runner
- Speed up testing by using Test Impact Analysis (TIA)
- Manage flaky tests
- UI testing considerations
- Azure Load Testing
- Azure Pipelines task reference, Test tasks
Related articles
Feedback
Coming soon: Throughout 2024 we will be phasing out GitHub Issues as the feedback mechanism for content and replacing it with a new feedback system. For more information see: https://aka.ms/ContentUserFeedback.
Submit and view feedback for